
Background
The phrase “comparative analysis” is commonly used in the context of fair lending compliance. In short, bank examiners will choose two sets of files where borrowers have similar financial characteristics such as debt-to-income ratio (DTI), loan-to-value ratios (LTV) and income. However, one set of borrowers was approved for their loans while the other set of borrowers were denied.
The examiners will then review the files for potential reasons why the denied borrowers were not granted credit when other similarly situated borrowers were approved. If there is not a legitimate business reason for denying the applicant(s) then the examiner may determine that there is unfair bias in the loan approval process.
For information on how I transformed the rough HMDA downloads into data that is easier to work with and analyze, I’ll be creating a post in the next few days on the steps I took to clean this data with the programming language, R. But for now enjoy this project and let me know if you have any questions!
The data used in this project was downloaded from the Consumer Financial Protection Bureau (CFPB): State-by-State HMDA data download
For the sake of this exercise, the criteria that I am using as a baseline for “good” credit is below:
- LTV <= 80%
- This is the historic standard for LTV as it correlates to a 20% down payment. But it’s worth mentioning that even conventional lenders may go up to 97% LTV (3% down payment) for qualified borrowers.
- DTI <= 36%
- DTI is based on pre-tax income and is a ratio of ‘fixed debts’ (car payments, student loans, etc.) to monthly income
Also, I excluded business purposes loans and loans for which the purpose was not to purchase or refinance residential property mortgages.
comp20 <- HMDA20KS %>% filter(action_taken == "Denied"
| action_taken == "Loan originated",
loan_to_value_ratio <= 80,
debt_to_income_ratio == "20%-<30%" |
 debt_to_income_ratio == "30%-<36%"|
 debt_to_income_ratio == "<20%",
business_or_commercial_purpose != "Business Purpose",
loan_purpose == "Purchase" |
loan_purpose == "Refinancing"|
loan_purpose == "Cash out refi")
comp21 <- HMDA21KS %>% filter(action_taken == "Denied" |
 action_taken == "Loan originated",
 loan_to_value_ratio <= 80,
debt_to_income_ratio == "20%-<30%"|
 debt_to_income_ratio == "30%-<36%" |
 debt_to_income_ratio == "<20%",
 business_or_commercial_purpose == "Not Business Purpose",
 loan_purpose == "Purchase" |
 loan_purpose == "Refinancing"
| loan_purpose == "Cash out refi")

twoyr_comp <- merge(comp20, comp21, all = TRUE)
Setting the Scene
In total across these two years, there were 4,598 denials of consumers that seemed to have the traditional markers of “good” borrowers.
twoyr_comp %>% count(action_taken, activity_year)

##      action_taken activity_year     n
## 1          Denied          2020  2224
## 2          Denied          2021  2374
## 3 Loan originated          2020 32661
## 4 Loan originated          2021 31695
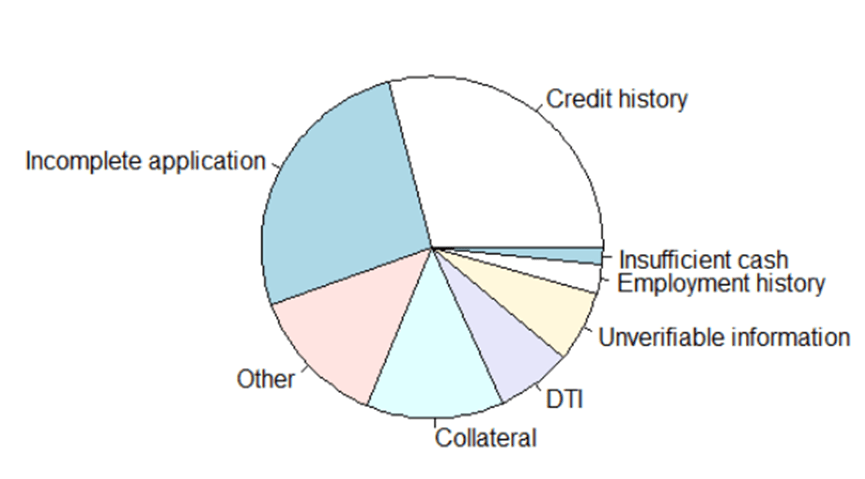
Surprisingly, around seven percent of these denied applications were denied *because* of their DTI (to reiterate, this subset had DTIs of less than 36%).
twoyr_comp %>% filter(action_taken == "Denied")
%>% count(denial_reason_1, sort = TRUE)

##            denial_reason_1    n
## 1           Credit history 1341
## 2   Incomplete application 1210
## 3                    Other  612
## 4               Collateral  595
## 5                      DTI  332
## 6 Unverifiable information  309
## 7       Employment history  124
## 8        Insufficient cash   75
To play devil’s advocate on behalf of the institutions that denied them, at a low enough income even a “reasonable” DTI can be worrisome from a credit risk perspective. For example, if you make (pre-tax) $1000 per month and have fixed debt of $350/month, your DTI would be a reasonable 35%. However, you would only have $650 to cover all other expenses for that month (and consider the amount that taxes would reduce that pre-tax income amount).
After digging a bit deeper, I uncover the existence of negative incomes. This is a bit of a setback but that’s ok, because that is part of what analyzing data is all about – finding things that meet your expectations and things that don’t. In the context of HMDA data, negative incomes may be reported in the case of a self-employed borrower that had a net loss for the year or it may be the result of typographical errors on behalf of the filing institutions.
twoyr_comp %>%
filter(denial_reason_1 == "DTI") %>% count(income <= 0)

##   income <= 0   n
## 1       FALSE 208
## 2        TRUE 117
## 3          NA   7
Deep Dive into a Peculiar Set of Denials
To recap, there are 208 individuals with reported income that were denied because of their DTI, even though they had DTIs of less than 36%, and LTVs of less than or equal to 80%. Forty-nine (49) unique institutions reported these 208 denials. One institution, LoanDepot.com LLC (last four LEI digits are ZP05), reported 63/208 (30%) of these denials.
NOTE: Institution names are not available in the LAR downloads, but there is an option to search LEIs on the FFIEC/CFPB website when searching for “Modified LAR” data.
twoyr_comp %>%
filter(denial_reason_1 == "DTI",
 income > 0) %>% count(lei, sort = TRUE)

##                     lei  n
## 1  549300AG64NHILB7ZP05 63
## 2  549300FGXN1K3HLB1R50 41
## 3  549300CRPIDBSEMEY066 18
## 4  549300SUCQ1358EGVE89  6
## 5  549300O0SJ54M4D70R54  5
## 6  549300XY701IELCE5Q08  5
## 7  5493007GBJOK22LYB425  4
## 8  549300IXP5DNWSGY6F96  4
## 9  549300J7XKT2BI5WX213  4
## 10 549300YIQ7S7Z8PIHE53  4
## 11 213800XR2TCBQJSF1X93  3
## 12 549300LYRWPSYPK6S325  3
## 13 549300RRQHIHHM9I4K21  3
## 14 SS1TRMSN6BRNMOREEV51  3
## 15 5493002QRULT2T40BH09  2
## 16 5493003GQDUH26DNNH17  2
## 17 5493006JISETNI0GLE61  2
## 18 549300C04BJ0G297NC13  2
## 19 549300FNXYY540N23N64  2
## 20 549300UVXY7S004OQL53  2
## 21 D32W5EBLENJC27207O81  2
## 22 213800QUAI2VH5YM6310  1
## 23 254900L3UJN7196A5W71  1
## 24 254900TTZ395IC926125  1
## 25 254900ZFWS2106HWPH46  1
## 26 5493001J5Z6NXCZKQR68  1
## 27 5493003P55WOWIBVUF09  1
## 28 5493009SXBJ8LKIU7Q54  1
## 29 549300ALNLUNS3Y53T24  1
## 30 549300AQ3T62GXDU7D76  1
## 31 549300C1ICNCM0V37Y02  1
## 32 549300C4ZH7G6OB81F33  1
## 33 549300CPT4UV65RIEU74  1
## 34 549300DT7WZ1SOTNFJ62  1
## 35 549300DX0B304LAKUN93  1
## 36 549300FV8093AKDLHQ80  1
## 37 549300JMT2KAYN9PTX82  1
## 38 549300KIOYNU323LVJ37  1
## 39 549300MGPZBLQDIL7538  1
## 40 549300NB3SBC1KHAWB92  1
## 41 549300U3721PJGQZYY68  1
## 42 549300UFWBQTD1W41E26  1
## 43 549300V1JRN7CMTCF305  1
## 44 549300ZX4OGRPOOEH505  1
## 45 7DMUJTL9FFTVIAG9H788  1
## 46 B4TYDEB6GKMZO031MB27  1
## 47 Q708HHR4LD2B7XIZNO92  1
## 48 QOT5WN9RBKQTFRVKEV31  1
## 49 VNOO6EITDJ2YUEBMSZ83  1
If they were a very high-volume reporter, it may be understandable for LoanDepot to have such a high concentration of these seemingly odd denials. However, between 2020 and 2021, they reported 3,458 total transactions in KS (across all action taken types). So between these two years, 63 (~2%) of transactions were denials of people with DTIs <36% and LTVs of <= 80% but were denied because of their “DTI”.
merge(HMDA21KS, HMDA20KS, all = TRUE) %>%
filter(lei == "549300AG64NHILB7ZP05") %>% count(activity_year)

##   activity_year    n
## 1          2020 1388
## 2          2021 2070
The second-largest reporter of these types of denials, Rocket Mortgage (last four LEI digits are 1R50), reported 41 of these denials, but their combined transaction volume in Kansas for 2020 and 2021 was 17,999, making these seemingly inaccurate denials just 0.22% (41/17999) of their reported transactions.
merge(HMDA21KS, HMDA20KS, all = TRUE) %>%
filter(lei == "549300FGXN1K3HLB1R50") %>% count(activity_year)

##   activity_year    n
## 1          2020 8384
## 2          2021 9615
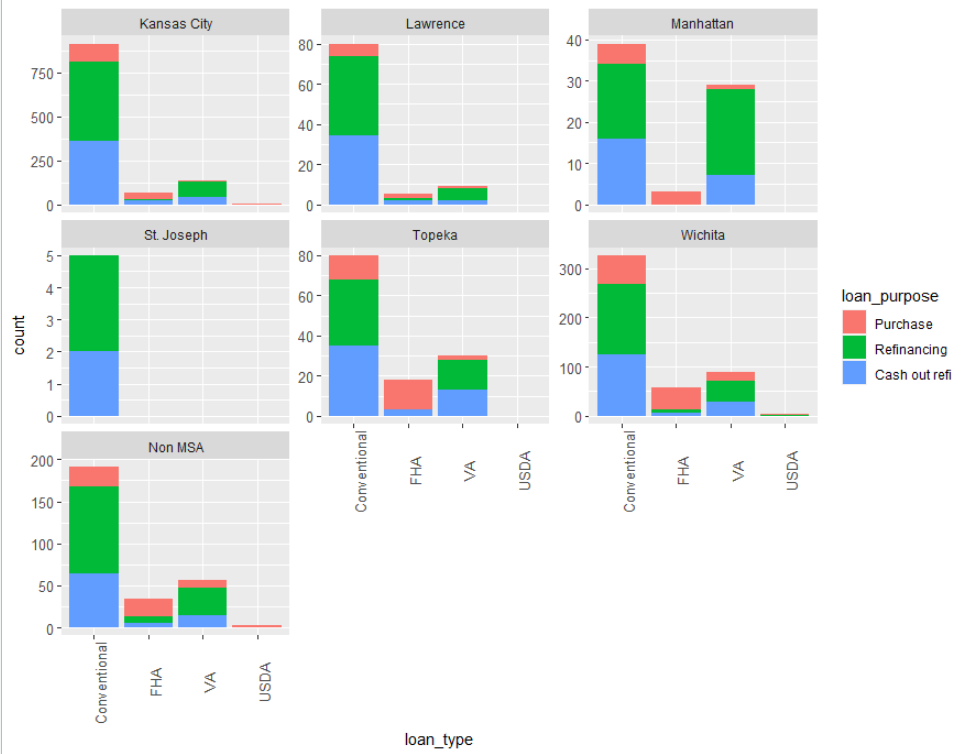
Nearly half of their reported 2020 and 2021 transactions in Kansas were on properties located in the Kansas City area. They also had substantial loan volume in Wichita. Conventional refinances (regular and cash out refinances) were their primary business, with loans of these types accounting for just over 65% of their loan originations for the two years.
merge(HMDA21KS, HMDA20KS, all = TRUE) %>%
filter(lei == "549300AG64NHILB7ZP05",
 action_taken == "Loan originated") %>%
count(loan_type, loan_purpose, sort = TRUE)

##       loan_type  loan_purpose   n
## 1  Conventional   Refinancing 789
## 2  Conventional Cash out refi 636
## 3  Conventional      Purchase 208
## 4            VA   Refinancing 205
## 5           FHA      Purchase 122
## 6            VA Cash out refi 103
## 7            VA      Purchase  40
## 8           FHA Cash out refi  37
## 9           FHA   Refinancing  26
## 10         USDA      Purchase   9
## 11         USDA   Refinancing   1

merge(HMDA21KS, HMDA20KS, all = TRUE) %>%
filter(lei == "549300AG64NHILB7ZP05",
 action_taken == "Loan originated")
%>% count(derived_msa_md, sort = TRUE)

##   derived_msa_md    n
## 1    Kansas City 1116
## 2        Wichita  477
## 3        Non MSA  285
## 4         Topeka  128
## 5       Lawrence   94
## 6      Manhattan   71
## 7     St. Joseph    5
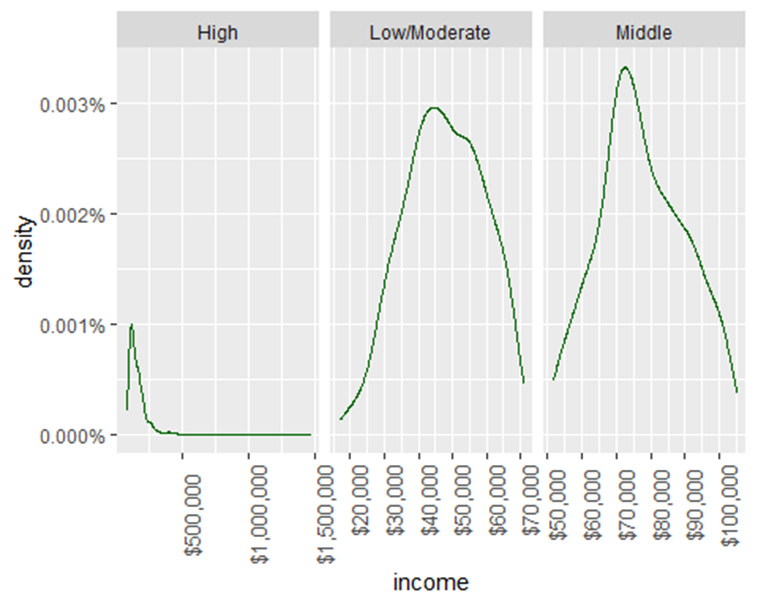
Most of their loans were made to high income borrowers, with a similar number of loans made to middle and low/moderate income borrowers. For borrowers that had reported income, the median borrower income amount was $76,000 while the average income amount was $95,322.
merge(HMDA21KS, HMDA20KS, all = TRUE) %>%
filter(lei == "549300AG64NHILB7ZP05",
action_taken == "Loan originated", income != "NA") %>%
count(income_level_type, sort = TRUE)

##   income_level_type   n
## 1              High 878
## 2            Middle 551
## 3      Low/Moderate 529
I thought of some interesting perspectives to check these denials against and needed to create some new columns in the two year comparison data frame.
- The first new column, called loan to income, is a ratio of the applicant’s loan amount divided by their reported income. From a credit risk perspective, a smaller number may represent a less risky transaction compared to a higher number
- Something I’ve heard throughout the years is to not spend more than 3x, I don’t know if that is rooted in anything factual
- The second new column, single borrower, is intended to capture applications for which there was just one applicant. It’s possible that a single applicant could be seen as riskier than multiple borrowers on one loan, especially in the context that if a one-person household loses their job, they have to rely on savings whereas a multiple-income household could get by on one person’s income in a short-term situation.
- But also worth noting that just because only one applicant is on the loan, doesn’t mean that they aren’t married or that they don’t rely on someone else’s income
twoyr_comp$loan_to_income <- twoyr_comp$loan_amount/
twoyr_comp$income

twoyr_comp$single_borrower <- as.factor
(ifelse(twoyr_comp$co_applicant_race_1 == "No Co-Applicant" |
 twoyr_comp$co_applicant_sex ==
"No Co-Applicant", "Yes", "No"))
The next perspective I was curious about was comparing how similar the qualities of denied loans were to the loans that were actually originated – and I used the new ‘loan to income’ column I created to visualize this. For this visualization, I used all loan originations and all denial reasons except for “Incomplete Application”, “Credit history”, “Unverifiable information”, or “Other”. I excluded these because they are certainly reasonable reasons to deny a loan and I don’t have the data within this data set to potentially refute the denial reason.
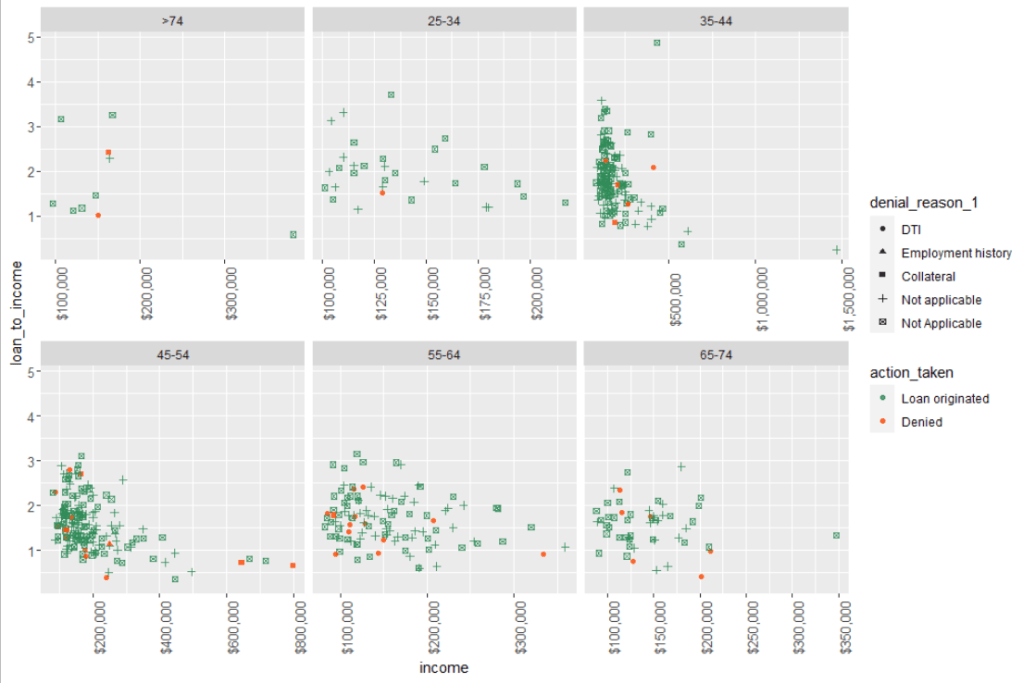
I found that the denials were similarly situated with originated loans. In some instances, the denied loans seemed less risky from a credit perspective than some of the originated loans. For example, in the 45-54 years old subset of the graphic, there is a denied loan with roughly $800k of annual income and a LTI ratio of around 0.5. The denial reason for that loan is “Collateral”.
For those who may not be well-versed in credit risk, collateral (the property or other assets that secure the loan) is important in the event that a borrower becomes insolvent, a bank or other financial institution can sell the underlying collateral and use those proceeds to pay off the loan. In the case of someone with $800K of annual income trying to get a loan for about $400K, collateral value doesn’t seem like it would be a pressing-enough issue to outright deny a borrower.
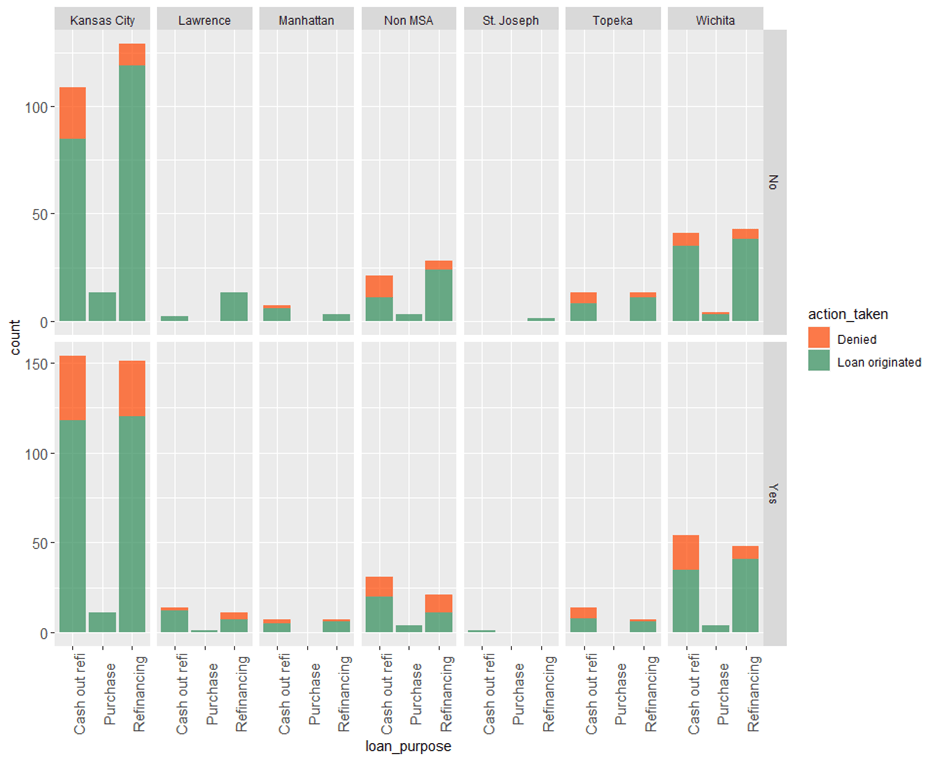
Finally, visualizing what role, if any, being a single borrower had in denials vs. approvals in this LoanDepot Kansas HMDA data. There were some instances where single borrowers made up a higher percentage of denials, for example refinances in the Kansas City MSA or Cash-out refinances in Wichita. But overall, there weren’t stark differences with regards to a borrower being a single applicant or not.
twoyr_comp %>% filter(lei == "549300AG64NHILB7ZP05") %>%
 count(derived_msa_md, action_taken, single_borrower,
 loan_purpose, sort = TRUE)

##    derived_msa_md  action_taken single_borrower  loan_purpose   n
## 1     Kansas City Loan originated          Yes   Refinancing 120
## 2     Kansas City Loan originated           No   Refinancing 119
## 3     Kansas City Loan originated          Yes Cash out refi 118
## 4     Kansas City Loan originated           No Cash out refi  85
## 5         Wichita Loan originated          Yes   Refinancing  41
## 6         Wichita Loan originated           No   Refinancing  38
## 7     Kansas City          Denied          Yes Cash out refi  36
## 8         Wichita Loan originated           No Cash out refi  35
## 9         Wichita Loan originated          Yes Cash out refi  35
## 10    Kansas City          Denied          Yes   Refinancing  31
## 11    Kansas City          Denied           No Cash out refi  24
## 12        Non MSA Loan originated           No   Refinancing  24
## 13        Non MSA Loan originated          Yes Cash out refi  20
## 14        Wichita          Denied          Yes Cash out refi  19
## 15    Kansas City Loan originated           No      Purchase  13
## 16       Lawrence Loan originated           No   Refinancing  13
## 17       Lawrence Loan originated          Yes Cash out refi  12
## 18    Kansas City Loan originated          Yes      Purchase  11
## 19        Non MSA          Denied          Yes Cash out refi  11
## 20        Non MSA Loan originated           No Cash out refi  11
## 21        Non MSA Loan originated          Yes   Refinancing  11
## 22         Topeka Loan originated           No   Refinancing  11
## 23    Kansas City          Denied           No   Refinancing  10
## 24        Non MSA          Denied           No Cash out refi  10
## 25        Non MSA          Denied          Yes   Refinancing  10
## 26         Topeka Loan originated           No Cash out refi   8
## 27         Topeka Loan originated          Yes Cash out refi   8
## 28       Lawrence Loan originated          Yes   Refinancing   7
## 29        Wichita          Denied          Yes   Refinancing   7
## 30      Manhattan Loan originated           No Cash out refi   6
## 31      Manhattan Loan originated          Yes   Refinancing   6
## 32         Topeka          Denied          Yes Cash out refi   6
## 33         Topeka Loan originated          Yes   Refinancing   6
## 34        Wichita          Denied           No Cash out refi   6
## 35      Manhattan Loan originated          Yes Cash out refi   5
## 36         Topeka          Denied           No Cash out refi   5
## 37        Wichita          Denied           No   Refinancing   5
## 38       Lawrence          Denied          Yes   Refinancing   4
## 39        Non MSA          Denied           No   Refinancing   4
## 40        Non MSA Loan originated          Yes      Purchase   4
## 41        Wichita Loan originated          Yes      Purchase   4
## 42      Manhattan Loan originated           No   Refinancing   3
## 43        Non MSA Loan originated           No      Purchase   3
## 44        Wichita Loan originated           No      Purchase   3
## 45       Lawrence          Denied          Yes Cash out refi   2
## 46       Lawrence Loan originated           No Cash out refi   2
## 47      Manhattan          Denied          Yes Cash out refi   2
## 48         Topeka          Denied           No   Refinancing   2
## 49       Lawrence Loan originated          Yes      Purchase   1
## 50      Manhattan          Denied           No Cash out refi   1
## 51      Manhattan          Denied          Yes   Refinancing   1
## 52     St. Joseph Loan originated           No   Refinancing   1
## 53     St. Joseph Loan originated          Yes Cash out refi   1
## 54         Topeka          Denied          Yes   Refinancing   1
## 55        Wichita          Denied           No      Purchase   1
Conclusion
The principles of credit risk are that potential risks must be mitigated with strength in some other area.
An example of a data check that the CFPB could implement is something like the analyzing the percent of denials with stated denial reasons of only “DTI” and reported DTI <= 20%. This approach could provide a foundation for zeroing in on potential fair lending findings and lead to more risk-focused comparative analysis reviews.
I believe that the data I’ve shown here has uncovered potential weaknesses with denied applicants that are of a similar credit risk profile as applicants that were approved for credit. These sorts of thought exercises are helpful because the CFPB has many syntactical and validity edits for data submissions (detailed in their yearly filing guides) but I couldn’t find any logical exercises or data quality checks similar to what I’ve done here.
Latest from the Blog

Google Data Analytics Case Study
As part of Google’s Data Analytics certificate, students were asked to choose from one of two cases (or pursue your own project!). Below are the slides from my finished project.

Beginning on Kaggle
I’ve finished (?) the beginning steps on my first project on Kaggle! I likely am not completely done but as a beginner, I don’t know what I don’t know. I cleaned a pretty messy data set. The dataset included data on mortgages originated and mortgage applications for the state of Kansas during 2020. In the…

Back in the saddle! Earning a data analytics certificate
Hi world! One of my goals for 2022 is to get back to a level of consistency with this blog and sharing my journey into become a data and business intelligence analyst. As such, I wanted to share my ongoing experience of earning Google’s Data Analytics certificate. “Get started in the high-growth field of data…

Leave a comment